Advancing Laboratory Standards: Our Journey from Manual Verification to Autoverification in Clinical Diagnostics
Smitha S, Dr. Deepti Jain
Smitha S1 , Dr. Deepti Jain2
1,2 Department of Laboratory Medicine, MIOT Hospital, Chennai 600089, India
Corresponding author:
Mrs. Smitha S
4/112, Mount Poonamallee Road,
Manapakkam
Chennai, India
Email: qdlm@miotinternational.com
APFCB News Volume 4, Issue 1
Introduction:
The clinical laboratory serves a key role in healthcare, bridging the gap between patients and clinicians. However, laboratories worldwide face the challenges of increased workloads and the accompanying pressure to deliver timely, accurate, and consistent reports. Over the past decade, laboratory medicine has undergone substantial evolution, with advanced analytical instrumentation taking centre stage in technological progress. However, global statistics indicate that over 65% of laboratory errors occur outside the analytical stage, predominantly in the pre- and post-examination phases. Thus, automating these phases is instrumental in reducing errors and enhancing patient safety.
Autoverification in clinical laboratories refers to the automated process of validating and releasing test results directly to healthcare providers, minimizing manual review and allowing staff to prioritize high-impact tasks. This post-analytical process represents the final quality assurance step before results are archived in the patient data repository (1). By applying predetermined criteria to all test results, it enhances error detection, reduces turnaround time, and increases work efficiency by allowing laboratory staff to focus on cases that truly require manual intervention (2)
At MIOT Hospitals, a 1,000-bed tertiary care center, we embarked on a three-month project to standardize the pre- and post-examination phases through total laboratory automation. Our goal was to design and validate an Autoverification algorithm for routine biochemistry, immunoassays, and serology testing. This transition has markedly streamlined laboratory workflows, reduced errors, and improved turnaround times—ultimately contributing to enhanced patient safety."
Materials and Methods:
In the planning phase, we audited our laboratory workflow. The study progressed through two phases: the pre-automation phase, involving manual report release and verification, and the automation phase, implementing Autoverification. The laboratory caters to a wide range of mixed populations 24x7 and conducts around 90,000 tests per month. All chemistry, immunoassay, and serology assays were performed on VITROS 5600 and VITROS XT 7600 analyzers from QuidelOrtho using micro-slide, micro-tip, and micro-well technologies. Auto verified results were transferred to our middleware, Instrument Manager by Data Innovations, interfaced with the LIS (IQVIA) and VITROS analyzers.
Auto verification Algorithm Setup:
The Auto verification setup involved a two-phase approach. First, the software phase, where live clinical specimens were allowed for rule simulation and algorithm refinement (single and combination rules), followed by hardware implementation. The algorithm development was done based on CLSI Auto 10A guidelines (3) and accreditation requirements based on ISO 15189:2022 standards (4). Criteria included maintenance and calibration status, internal quality control, analytical measurement ranges, critical value alerts, delta checks, and consistency checks (see Table 1 for specific cross-check criteria). Quality checks for haemolysis, icterus, and turbidity indices ensured that all results maintained analytical integrity.
Specimen Selection:
To thoroughly test the Autoverification algorithm, a wide variety of clinical specimens were selected. This included specimens with low or high concentrations of specific measurands, those affected by haemolysis, icterus, or lipemia (HIT) interferences, and samples that fell outside the analytical measurement range. Additionally, specimens showing mild variations from previous results (delta checks), those with critical alert values, and samples requiring dilution due to high concentrations were included. Internal quality control (IQC) failures and the status of results processed within the defined period were also analysed.
Laboratory Information System (LIS):
Our hospital utilizes the IQVIA software for LIS which is equipped with foundational rules for manual result verification and this served as the baseline for algorithm development. Essential components of the verification protocol included simulation testing on clinical specimens, algorithm approval, thorough documentation, and subsequent implementation and maintenance of the auto verification rules. Middleware was interfaced with the LIS software, enabling the documentation of common auto verification challenges—such as specimen rejections, instrument error flags, and decimal transcription errors—throughout the verification process.
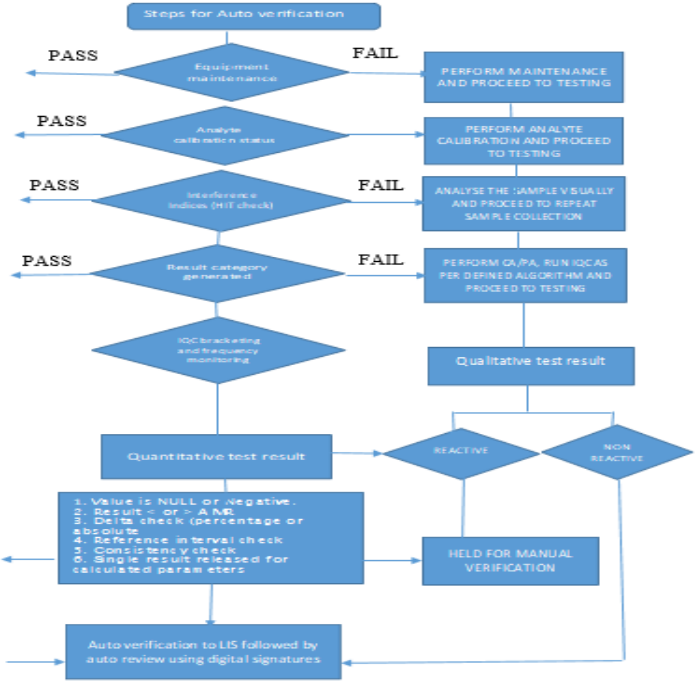
Autoverification Algorithm Criteria: All the algorithms designed for Autoverification in middleware are colour coded aprropriately for the user to be made aware of the results failing the AV criteria. Some of the algorithms that are programmed in the middleware include:
A1: Maintenance and Calibration Compliance
The Autoverification (AV) system is programmed to track routine equipment maintenance and analyte calibration requirements within the middleware. Testing is restricted if maintenance is overdue, or calibration frequency has been exceeded and since the instruments are connected on track, the tests are automatically forwarded to the next equipment where the quality criteria were met as per the predefined standards.
A2: Internal Quality Control (IQC) and Calibration
Our laboratory follows NABL 112:2019 guidelines for performing IQC across all analytes under AV. The number of levels of IQC and time intervals are also mapped in the middleware based on accreditation requirements. IQC results are automatically relayed to the Bio-Rad Unity realtime software through the middleware, and SQC rejection rules are embedded in the middleware. If an QC outlier is detected, samples are redirected to another instrument to prevent result recalls. Alerts are generated in the middleware for outliers and also when IQC is pending based on preset frequency, preventing sample analysis until IQC completion or corrective action is initiated.
A3: Analytical Measurement Range (AMR)
The AMR, specifying the concentration range that can be directly measured without further treatment, is pre-set in the middleware. Results outside this range are held for manual verification, and any results requiring dilution are held in the middleware for further dilution or review.
A4: Critical Values
Critical results flagged by the middleware for immediate attention are held and communicated promptly to healthcare providers, as required for patient safety and as per accreditation standards. The middleware records the communication details, including time of reporting and a confirmation read-back to ensure information accuracy, aligning with CLSI GP 47(5) requirements.
A5: Delta Check
Delta checks are evaluations which compare consecutive results for the same patient. They also help to detect sample misidentification, contamination, or significant clinical changes. Each analyte has programmed delta limits (percentage or absolute) in the middleware based on CLSI EP 33 guidelines (6) and BV criteria (7) and any results exceeding these limits are held for manual review.
A6: Consistency Check
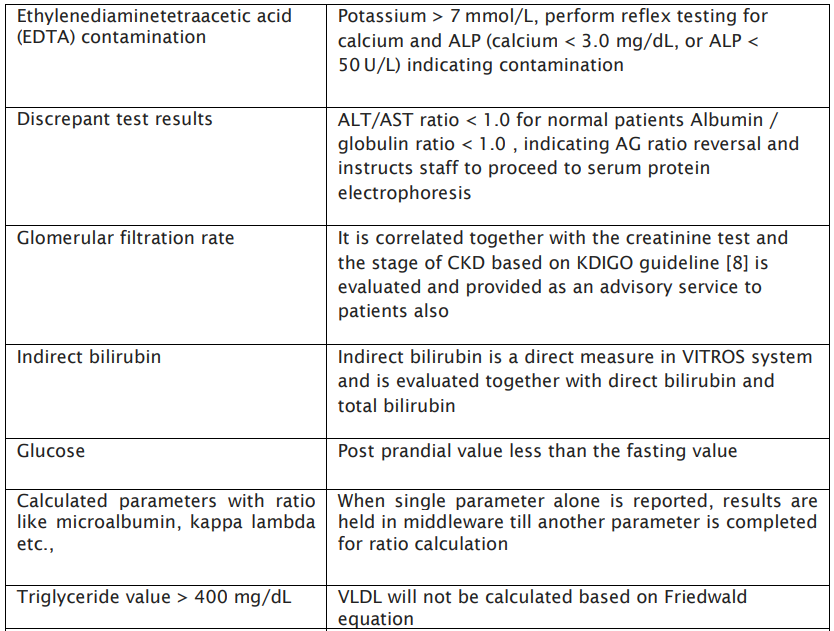
Consistency checks are programmed to cross-verify related test results for accuracy, ensuring coherent, reliable results across correlated tests, as specified in the verification protocol’s Table 1.
Table: 1 Specimen Consistency check:


A8: Reference Range Verification
Reference intervals, or ranges, are used by physicians to interpret patient test results, representing values that fall within the range observed in 95% of a healthy population. Values within this range are considered within normal limits (WNL). Limits exceeding WNL are designated as the upper reference limit (URL) or upper limit of normal (ULN), while values below WNL are the lower reference limit (LRL) or lower limit of normal (LLN). All test results falling outside these reference ranges are flagged in the middleware for manual verification.
A9: Interference (HIT Index) Verification
Every sample processed on the VITROS analyzers undergoes automatic assessment for haemolysis, icterus, and turbidity (HIT) indices using VITROS’ Intellicheck technology. Samples with interference levels exceeding manufacturer-defined thresholds are held in the middleware, requiring manual verification to ensure accuracy before release.
A10: SEROLOGY TESTING
Qualitative assay results reported as reactive will be held by the system and will require manual intervention for authentication, in accordance with the criteria specified in the Autoverification Algorithm. Results that are non-reactive will be automatically authenticated if they fall within the AV rules.
RESULTS AND DISCUSSION
During the study period, the Clinical Biochemistry division received a total of 2500 samples and performed [2,70,000] tests. The efficacy of automation in Autoverification was evaluated through several factors, including the rate of Autoverification, rate of manual verification, reasons for manual verification, any report amendments, manpower requirements, and the overall improvement in turnaround time (TAT) in the laboratory.
Auto verification Success Rate:
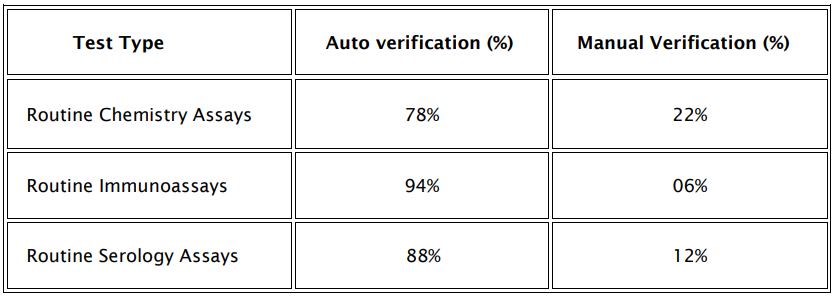
AV success rate was determined as a percentage of total number of tests auto verified against total number of tests performed in the division per day. The rate of auto verification were studied for routine chemistry assays, routine immunoassay tests and serology assays and the rates are depicted in table 3.
Table: 3 Auto verification Success rate Vs Manual verification
Reasons for Manual Verification
The most prevalent causes for holding test results in the middleware for manual verification are outlined in figure: 1

Figure: 1 Cause analysis for manual verification of test results
Cross-verification of patient results by authorized signatories indicated a 98% agreement rate between manual and auto verified results. Notably, discrepancies primarily arose in serology assays and TSH tests, largely due to insufficient patient history and reactive results, with delta check failures being the most common reason for results being held as depicted in table 4.
Improvement in Turnaround Time
The implementation of Auto verification resulted in significant improvements in TAT, as illustrated in Fig. 2:
TAT Before & After AV implementation
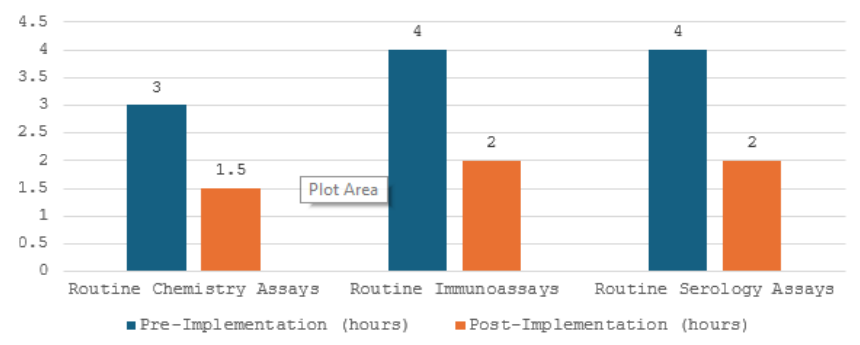
Figure: 2 TAT improvement pre and post AV implementation
Discussion:
Auto verification uses complex rule-based systems to validate test results that do not require a manual verification. Currently, laboratories use AV in different groups of tests, including routine tests which are biochemistry, immunoassays, haematology, coagulation, blood gas, and urinalysis (9). All the algorithms developed were validated and approved by the medical director before use and were also regularly reviewed and verified as per ISO 15189:2022[4] requirements.
AV has shown improved benefits with respect to test quality, error rates reduction, decreased TAT thereby improvement in lab efficiency. Our study focussed primarily in developing an algorithm to reduce pre analytical errors such as sample mix-up, anticoagulant contaminations, diluted and lysed samples as was evident in the consistency check algorithm developed in Table:1 apart from IQC outliers, delta check limits, AMR, reference ranges, critical alerts, sample indices etc. Many previous studies have also explained algorithms based on analytical measurement range, critical values, error codes encountered, delta check, sample indices etc.(10,11)
Auto verification Success rate:
Our results show a 78% AV rate for routine chemistry tests followed by 94% for immunoassays and 88% for serology assays as depicted in Table 3. Similar AV rates were obtained in studies done by Rashmi and Anurag (1) who reported AV rate of 53.7-85.4%. Another study by Dr.Subhosmito Chakraborty (12) shows an AV rate of 78% for all metabolic tests studied in his setup. The AV success rate reported in different studies have shown wide differences (13-15) probably due to using different result limit checks and delta check limits and developments in AV rules. Similar to this study, Shih et al (16) reported the AV rate to be as high as 95% for all the test results, which is higher than the findings of this study. This difference could be because in their laboratory, acceptable range for the delta check and limit check for each test item might be different from ours.
A detailed analysis of routine chemistry assays indicated that tests such as AST, ALTV, amylase, lipase, HDL, PSA, anti HIV testing and LDL had the highest Auto verification rates. Conversely, tests like urea, creatinine, sodium, potassium, chloride, HBsAg, Anti HCV, and others showed lower validation rates, correlating with our institution’s focus on nephrology (45%) and hepatic (25%) patients, alongside departments such as oncology, diabetes, and orthopedics.
Manual verification:
In design of an AV algorithm, one of the important issues is performing an in-depth root cause analysis of manually verified test results. Manual verification is a time-consuming activity with builtin subjectivity and cannot provide sufficiently accurate verification of test results (14) When a large number of results especially in a large Mult speciality hospital are pending for review, fatigue can develop, and this is considered to be a high risk factor for laboratory errors (17). In our study, the most common reasons for non-validated results were delta check, IQC bracketing, reference range check limits and serum indices respectively.
The less common reason for manually verified test result was critical alert (2%) among the tested analytes (Figure 1). Similar results were also obtained in a study done by Rimac et al. who reported that among 31 different biochemical tests, the least common reason for non-validated results was the critical value (2%) (18).
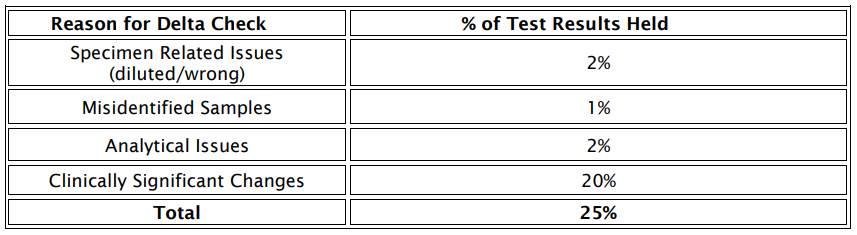
Delta check:
The laboratory had further attempted to identify the reason for the major junk of results held due to establishment of delta check limits and the reason was identified to be clinically significant changes within the individual as major cause (Table4). Several studies have recommendations defined on use of delta checks in designing AV algorithms (19,20,21).
In our present study, the delta check limits were determined from the biological variation database. The delta check limit used for the CREA test was ± 15%, and the AV rates were between 60% and 79%. This was in comparison to previous study in which delta check limits were evaluated as < 20% and AV success rates between 50% and 75% were obtained and also studies by Onlu Gul B et al where the rates were between 65 and 79% with a delta check of ± 13%. The AV success rates reported in multiple studies have shown differences (22,23,18)primarily due to using different delta check limits and developments in AV rules over time.
Agreement rate:
Cross-verification of patient results by authorized signatories indicated a 98% agreement rate between manual and auto-verified results. Notably, discrepancies primarily arose in serology assays and TSH tests, largely due to insufficient patient history and reactive results, with delta check failures being the most common reason for results being held as depicted in table 3. Similar studies of degree of agreement were done by seven different reviewers and the agreement rate was found to be significant between 79% to 88% indicating a stable algorithm. Mohy-Sediq et al. compared AV system results to results provided by 4 reviewers, and the agreement rates were between 73% and 77%, which were lower than those in our study (24) .The validation of AV rules is crucial in ensuring that the AV system operates as intended and requires high attention to detail.
We evaluated the efficacy of AV by assessing the significant improvement in TAT for all routine assays, and immunoassays which showed around 97% TAT improvement for chemistry assays and 96% for immunoassays(Figure 2) when compared to the previous performance of the laboratory. Similar studies post-AV implementation have depicted an 88.28– 97.32% for immunoassays and 82.7–95.68% for routine chemistry parameters.
The result recall rates due to failed IQC results improved from 4.3 sigma to 6 sigma, attributable to the introduction of IQC bracketing. Automated documentation of IQC outliers via transfer to Bio-Rad Unity real-time software significantly reduced the manual workload associated with transcription thereby minimizing errors and rate of recalls. The reduced error rates as evidenced by the decreased number of amended reports reduced the need for manual verification. In this study, we found that for verification of around 2500 tests per day, an average of 6-7 manhours per signatory is being spent which has been reduced to around 3 hrs per day by AV. The extra time generated was used for study purposes, staff training and competency-related activities, verification protocol design for new tests etc.
Risk Management in Auto verification
Every algorithm within the auto verification process designed in the laboratory has an effective risk management strategy, enabling the rapid suspension of automated selection, review, and release of test results so that patient care is not at risk. This is also a mandatory requirement of accreditation of laboratories as per ISO 15189:2022(4).
Conclusion:
The implementation of auto verification (AV) in our clinical laboratory has significantly enhanced operational efficiency, accuracy, and patient safety. The AV system successfully reduced manual verification rates, with success rates of 78% for routine chemistry assays, 94% for immunoassays, and 88% for serology assays, thereby allowing laboratory personnel to focus on critical tasks. Notably, the turnaround time (TAT) for routine tests improved by 35%, directly contributing to faster clinical decision-making. Delta check algorithms and consistency checks reduced preanalytical errors, with a 98% agreement rate between manual and auto-verified results, underscoring the system's reliability. These advancements affirm that AV, when properly designed and implemented, streamlines laboratory workflows and ensures consistent quality standards, ultimately improving.
1. Edward W Randell, Sedef Yenice , Aye Aye Khine Wamono , Matthias Orth .Autoverification of test results in the core clinical laboratory. Clin Biochem 2019 Nov:73:11-25. PMID: 31386832, DOI: 10.1016/j.clinbiochem.2019.08.002. doi: 10.1016/j.clinbiochem.2019.08.002. Epub 2019 Aug 3.
2. Dustin R Bunch , Thomas Js Durant, Joseph W Rudolf . Artificial Intelligence Applications in Clinical Chemistry.Clin Lab Med 2023 Mar;43(1):47-69. doi:10.1016/j.cll.2022.09.005. Epub 2022 Dec 15. PMID: 36764808 DOI: 10.1016/j.cll.2022.09.005
3. The CLSI document for AV of clinical laboratory test result (AUTO-10A) provides all CLSI AUTO10-A, Autoverification of Clinical Laboratory Test Results; recommendations needed for laboratories to implement the AV algorithms.
4. Medical laboratories — Requirements for quality and competence, ISO 15189: Fourth edition 2022-12.
5. The CLSI document for Management of critical and significant risk results-GP47:Ed1.
6. The CLSI document for use of delta check in laboratory-EP33:Ed2.
7. Ricós C, Alvares V, Cava F, García-Lario JV, Hernández A, Jimenez CV, et al. Desirable biological variation database specifications. The 2014 update. Available from: https://www.westgard.com/biodatabase1.htm. Accessed Dec 9th 2021
8. KDIGO 2024 Clinical Practice Guideline for the Evaluation and Management of Chronic Kidney Disease-VOL 105: 4S. April 2024.
9. Topcu DI, Gulbahar O. A model to establish Autoverification in the clinical laboratory. Clin Biochem. 2021;93:90-8. https://doi.org/10.1016/j.clinbiochem.2021.03.018
10. Rimac V, Jokic A, Podolar S, Vlasic Tanaskovic J, Honovic L, Lenicek Krleza J. General position of Croatian medical biochemistry laboratories on Autovalidation: survey of the Working Group for Post-analytics of the Croatian Society of Medical Biochemistry and Laboratory Medicine. Biochem Med (Zagreb). 2020;30:020702. https://doi.org/10.11613/ BM.2020.020702 19.
11. Torke N, Boral L, Nguyen T, Perri A, Chakrin A. Process improvement and operational efficiency through test result Autoverification. Clin Chem. 2005;51:2406-8. https://doi. org/10.1373/clinchem.2005.054395.
12. Subhosmito Chakraborty. Autoverification in Clinical Biochemistry in an Indian Cancer care set up: Implementation and achievements.APFCB News 2022 Issue 2, page 83-87.
13. Wu J, Pan M, Ouyang H, et al. Establishing and evaluating Autoverification rules with intelligent guidelines for arterial blood gas analysis in a clinical laboratory. SLAS Technol 2018;23:631– 640. DOI: 10.1177/2472630318775311.
14. Jin D, Wang Q, Peng D, Wang J, Li B, Cheng Y, et al. Development and implementation of an LIS-based validation system for Autoverification toward zero defects in the automated reporting of laboratory test results. BMC Med Inform Decis Mak. 2021;21:174. https://doi.org/10.1186/s12911- 021-01545-3.
15. Topcu DI, Gulbahar O. A model to establish Autoverification in the clinical laboratory. Clin Biochem. 2021;93:90-8. https://doi.org/10.1016/j.clinbiochem.2021.03.018
16. Shih MC, Chang HM, Tien N, Hsiao CT, Peng CT. Building and validating an Autoverification system in the clinical chemistry laboratory. Lab Med. 2011;42:668–73. 10.1309/LM5AM4IIXC4OIETD.
17. Randell EW, Yenice S, Khine Wamono AA, Orth M. Autoverification of test results in the core clinical laboratory. Clin Biochem. 2019;73:11-25. https://doi.org/10.1016/j.clinbiochem.2019.08.002.
18. Rimac V, Lapic I, Kules K, Rogic D, Miler M. Implementation of the Autovalidation algorithm for clinical chemistry testing in the laboratory information system. Lab Med. 2018;49:284- 91. https://doi.org/10.1093/labmed/lmx089
19. Randell EW, Yenice S. Delta Checks in the clinical laboratory. Crit Rev Clin Lab Sci. 2019;56:75-97. https://doi.org/10.1080 /10408363.2018.1540536.
20. Xia LY, Cheng XQ, Liu Q, Liu L, Qin XZ, Zhang L, et al. [Developing and application of an Autoverification system for clinical chemistry and immunology test results]. Zhonghua Yi Xue Za Zhi. 2017;97:616-21. (in Chinese)
21. 24. Fernández-Grande E, Valera-Rodriguez C, Sáenz-Mateos L, Sastre-Gómez A, García-Chico P, Palomino-Muñoz TJ. Impact of reference change value (RCV) based Autoverification on turnaround time and physician satisfaction. Biochem Med (Zagreb). 2017;27:342-9. https://doi.org/10.11613/ BM.2017.037
22. Wu J, Pan M, Ouyang H, Yang Z, Zhang Q, Cai Y. Establishing and evaluating Autoverification rules with intelligent guidelines for arterial blood gas analysis in a clinical laboratory. SLAS Technol. 2018;23:631-40. https://doi. org/10.1177/2472630318775311.
23. Wang Z, Peng C, Kang H, Fan X, Mu R, Zhou L, et al. Design and evaluation of a LIS-based Autoverification system for coagulation assays in a core clinical laboratory. BMC Med Inform Decis Mak. 2019;19:123. https://doi.org/10.1186/ s12911-019-0848-2
24. Sediq AME, Abdel-Azeez AGH. Designing an Autoverification system in Zagazig University Hospitals Laboratories: preliminary evaluation on thyroid function profile. Ann Saudi Med. 2014;34:427-32. https://doi.org/10.5144/0256- 4947.2014.427 .